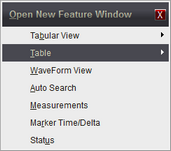
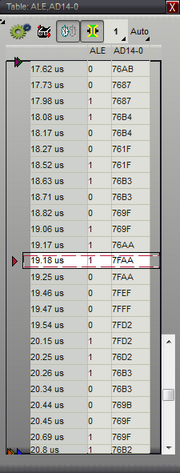
Table views present the data as a list of numbers (tabular form). Table windows can be created by using the Feature Window button on the Top Toolbar, or by using the Main Menu (Menu-> Window-> New-> Table View). Table creation selections in the Main Menu and Feature Window lists are only available after creating a Signal Definition.
Any signal type can be displayed in Tables. However, decoded signals will be displayed in their raw channel values. To see the decoded values of these signals in a tabular view see Tabular Views.

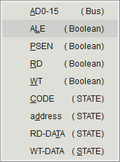
To create a new Table Window, select the Open Feature Window button (highlighted above) from the main toolbar, then select the name of a defined signal from the Table menu item. Only the Signal Definitions you create for the project will be listed on the Tabular View.
|
|
|
▪Multiple tables can be created and viewed simultaneously. ▪Multiple signals can be viewed with each signal in a separate column. ▪Multi-Channel Signals can be "expanded" to multiple columns. ▪Expand order of Multi-channel signals can be reversed. ▪Signal column order can be re-arranged by dragging. ▪Bus Signals can be formatted as Binary, HEX or Decimal. ▪Time Display can be set to Auto, ns, us, ms, sec, min, hrs, days or weeks. ▪Time Format can be set to Delta or Absolute. ▪Time Column can be hidden. ▪Set, Clear or Jump to markers. (see Using Markers) ▪Assign Time Synchronized Link Group. (see: Using Link Groups) ▪Select which Signals to view in each Table. ▪Edit Signal Properties. (see: Signal Editors) ▪Print current Table View or Save as JPEG. (see: Printing) ▪Export data using Table's settings. (see: Exporting Tables)
While most manufacturers provide table views, they generally are not too useful for anything other than STATE mode signals. Most logic analyzer demos will show data changing on every sample, making the table view look interesting in timing mode. However, in real usage, most signals do not change at anywhere near the sample rate, causing the table to show a small sample of stable data. You might have to scroll several screens before seeing the signal transition. We have added several enhancements to the basic table view to make them truly beneficial in real-world usage. |
Compressed View 
This mode compresses out the 'dead-time' between transitions, packing a lot more information into a screen of table data. Each line of data in the table contains the timestamp and the data. The time between lines varies and corresponds to the length of time the previous sample was stable. In this mode, a 40 line table contains 40 transitions. In linear (non-compressed) mode, it would contain 40 SAMPLES with perhaps NO transitions. If multiple signals are added to the table, the compression algorithm takes ALL signals in to account. A new line is shown any time ANY of the signals change state. Nothing is lost or thrown away. We simply compress out the redundant information, making the table hold more significant data. You can switch between compressed and linear views with a single click at any time.
Although compressed mode is the most efficient way to display a signal in tabular form, some people have trouble visualizing the non-linear, compressed time. You can Link a compressed table with other non-compressed tables or with waveform displays to correlate the data to a linear view. This allows BOTH an efficient table view and a linear 'in-context' view.
The included '8051.dvdat' example demonstrates this well. The OE signal in that example is spread across about 1.4 Million samples but can be displayed in less than 20 table lines when compression is enabled. When this table is linked to a waveform view, scrolling through this small table quickly scrolls the waveform to each significant event in the OE signal. This is a real-world example captured from a real embedded system.
Delta vs. Linear time
Regardless of the display mode( normal, compressed or down-sampled), you can display the time field in absolute or delta time. Absolute is the actual timestamp of the sample (relative to trigger). DELTA mode shows the time between table lines. This is most useful in compressed mode where it tells you the time between transitions. In normal and down-sampled modes, it simply tells you the sample rate( since the time between each line is constant).
Table Menu 
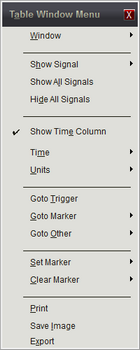
The table's menu offers several useful functions such as navigating to a reference point, adding additional signals, configuring the time and so forth. Example of this menu is displayed below.
Table General Menu: |
|
Signal Menu
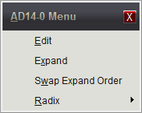
Each signal in the table has its own menu options. To activate the menu for a specific signal from within the table, right-click in the signals' column. Example of this menu is displayed below.
Table Signal Menu: |
|
